
Dear Friends,
I got really interesting information if you are gold lover ... or metal investor... cash is trash and gold and silver is money ( reach dad poor dad book). just find below information all the data in represent in US $.
let me clear you something if you dot know about Troy Ounce
Troy Ounce (ozt) is a unit of imperial measure. In the present day it is most commonly used to gauge the weight and therefore the price of precious metals. One troy ounce is equivalent to 31.1034768 grams. There are 32.1507466 troy oz in 1 kg. One troy ounce is equivalent to 1.09714 avoirdupois ounces.
so 1 Tola = 10 gm, SO troy ounce is almost 3 tola of gold. (aprx)
as per the report gold will be treading 1800 to 2000 US $ in short time which will be almost 27000 to 30000 INR.
enjoy the report and buy some GOLD ANS SILVER
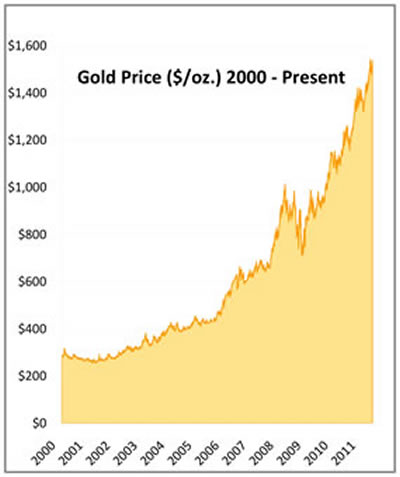
Gold had enjoyed five years of gains after bottoming in 2001, reaching a 26-year high of $730 that May, but was undergoing a significant correction that would ultimately erode 28% of its value in just over a month. It was the single largest loss of value the gold market had seen since its collapse in 1980
Many financial analysts were calling it the end of the bull market in gold. We at USAGOLD had a different theory, one that we published in the midst of that pullback entitled, “Bargain Buying: Take Advantage of the Summer Doldrums.”
In our analysis, we discovered that each and every year spanning 2001-2006, the gold market would show price weakness in the first two months of the summer. From there, prices moved decisively higher by year’s end, with the vast majority of the gains (better than two-thirds) for the full year (the lone exception, 2002) coming after the June/July swoon. This trend is clearly illustrated in the graphs to the right. On average, gold gained 11.8% over the last 5 months of those years, which annualized to an impressive 28.32% appreciation.


Needless to say, gold’s bull run did not end with that pullback in the summer of ’06. After bottoming in the $560 range, gold quickly rallied, and its meteoric rise since has caught the attention of even its most ardent critics:


Fast-forward to June 2011…
Gold is slightly off after achieving an all-time high at $1572 per ounce this May and has begun to consolidate around the $1500 level. Many in the financial press are suggesting we have once again reached the end to the yellow metal’s bull market. They cite the recent price weakness along with hedge fund billionaire George Soros’ decision to liquidate the entirety of his position in the gold ETF as evidence that the market has reached a top. Yet none of the catalysts that contributed to gold’s rise over the past ten years have subsided. If anything, they have intensified.
Gold is slightly off after achieving an all-time high at $1572 per ounce this May and has begun to consolidate around the $1500 level. Many in the financial press are suggesting we have once again reached the end to the yellow metal’s bull market. They cite the recent price weakness along with hedge fund billionaire George Soros’ decision to liquidate the entirety of his position in the gold ETF as evidence that the market has reached a top. Yet none of the catalysts that contributed to gold’s rise over the past ten years have subsided. If anything, they have intensified.
To the point, another notable hedge fund billionaire, John Paulson, showed no hesitation in retaining the entirety of his position in GLD. In fact, his ownership stake still represents the largest single holding in the ETF. In justifying his decision to skeptics, Paulson stated in an April interview with the Wall St. Journal, “The United States and the United Kingdom have flooded their respective economies with money in order to fuel a more-robust economic recovery. That rush of money will apply inflationary pressures on those economies, making gold poised to the hit the $4,000 mark in a few years.”
As it was in 2006, the actionable trend typical of the summer doldrums has proven to be reliable and predictable, and is perhaps once again a more reasonable explanation of the recent, albeit limited, weakness in the gold price.
Bolstering the point, the last five years have seen nearly the exact same post-doldrums performance as the five years preceding them, with gains after June/July averaging 11.25%, or 27% annualized. Due to the onset of the financial crisis, 2008 represents the only year in the last ten where this trend did not hold true. Gold was not immune to the massive de-leveraging that took place in all asset classes, and took a significant hit in September and October of that year. Even though the price of gold recovered by year’s end, it was slightly more than 5% worse than the average price over the June/July period. Adding strength to the overall argument, however, the post-summer trend remained sufficiently strong in the other four years to achieve nearly the same aggregate average as the first five years of the bull market, despite the negative data in 2008.
Over the full period of this decade-long study, gold has averaged annual gains of 17.42%. The average gain after the June/July swoon has been 11.46%. In other words, on average, just better than 2/3 of all annual gains over the past ten years in gold have come in the last five months of the year.

The combination of the escalating sovereign debt crisis in Europe, the unknown future of the Fed’s quantitative easing program, the ongoing debt ceiling debate, the early warning signs of inflation, especially in food and commodities (as illustrated in our latest newsletter), and ongoing geopolitical instability promise to make the second half of 2011 very interesting for the gold market. Whether or not a meaningful pullback will manifest in the next two months is unknown, but the past ten years do make one thing abundantly clear: If you’re looking to add gold to your portfolio, taking advantage of the summer doldrums can be a reliable and rewarding strategy.
Disclaimer: Opinions expressed in commentary e do not constitute an offer to buy or sell, or the solicitation of an offer to buy or sell any precious metals product, nor should they be viewed in any way as investment advice or advice to buy, sell or hold. Centennial Precious Metals, Inc. recommends the purchase of physical precious metals for asset preservation purposes, not speculation. Utilization of these opinions for speculative purposes is neither suggested nor advised. Commentary is strictly for educational purposes, and as such USAGOLD - Centennial Precious Metals does not warrant or guarantee the accuracy, timeliness or completeness of the information found here.
Ref :http://www.marketoracle.co.uk/Article28472
By Jonathan Kosares,USAGOLD - Centennial Precious Metals, Denver
No comments:
Post a Comment